The anthropometric and respiratory measurements of the subjects participating in this study are shown in Table 1. The same table shows the TDs of allergen, histamine, and when determined, acety-choline. The range of TDs of histamine was sixteenfold, between 0.08 and 1.28 mg. See articles in our site: https://onlineasthmainhalers.com/category/pathogenesis.
The average change at the threshold level varied with the measurement: 3.0 to 8.0 percent for FVC, 11.3 to 18.6 percent for FEVi, and 16.0 to 21.9 percent for FEF25-7585. The percent changes in FEFmax, (4.1 to 9.1) were comparable to the percent changes in FVC, and the percent changes in FEF50%, (15.8-22.6) and FEF75S5 (14.6-23.2) were quite similar to the percent changes in FEF25-75S5.

In eight subjects, the administration of 10 mg chlorpheniramine intravenously increased the TD of histamine four times (the ratio of TD histamine chlorpheniramine/TD histamine was four), whereas in one subject, the same amount of chlorpheniramine exhibited a dose-ratio of 8 (Fig 2). In seven subjects, 10 mg of this Hi blocker increased the TD of allergen twice (Fig 3). In one of these two subjects, 15 mg chlorpheniramine intravenously increased the TD to allergen twice (Fig 3) and the TD to histamine 8 times (Fig 2). The changes in histamine and allergen threshold doses produced by chlorpheniramine were significant at P
In none of the eight subjects included in this study had chlorpheniramine or atropine altered the basal forced expiratory flows. Specifically, mean FEVi remained within 5 percent of its basal value.
Table 1—Anthropometric Data, Respiratory Measurements and Threshold Dose To Allergen, Histamine and Acetylcholine
| Patient No./Sex/ Age, yr | Height,cm | FVC | FEVi | FEVi/FVC | FEFmax | FEF25-75% | FEF50% | FEF75% | Allergen | TDA | TDH | TDAC |
| 1/F /25 | 165 | 88 | 83 | 77 | 102 | 47 | 57 | 49 | cat hair | 250 | 0.08 | |
| 2/F /26 | 168 | 88 | 73 | 68 | 108 | 33 | 35 | 29 | cat hair | 250 | 0.08 | |
| 3/M/27 | 178 | 77 | 72 | 77 | 99 | 33 | 34 | 28 | ragweed | 10 | 0.08 | 0.4 |
| 4/M/27 | 183 | 110 | 92 | 67 | 104 | 47 | 47 | 43 | dog hair | 100 | 0.16 | |
| 5/F /27 | 171 | 86 | 71 | 71 | 89 | 34 | 35 | 34 | ragweed | 10 | 0.16 | 0.2 |
| 6/M/20 | 185 | 96 | 60 | 54 | 96 | 31 | 32 | 32 | ragweed | 100 | 0.32 | |
| 7/M/29 | 175 | 105 | 94 | 62 | 125 | 61 | 62 | 49 | ragweed | 20 | 0.32 | 0.2 |
| 8/F /24 | 168 | 94 | 94 | 82 | 94 | 49 | 58 | 50 | ragweed | 250 | 1.28 | |
| 9/F /24 | 160 | 113 | 88 | 65 | 92 | 67 | 83 | 64 | horse hair | 200 | 1.28 |
Figure 2. Influence of chlorpheniramine injected intravenously on threshold dose of inhaled histamine. Threshold dose of histamine is expressed in milligrams of histamine base delivered to patient Abbreviations: pretreat indicates pretreatment; TD, threshold dose; H, histamine, and CP, chlorpheniramine. Closed circles indicate changes in TD of H produced by 10 mg chlorpheniramine given intravenously. Open circle indicates changes in TD of H produced by 15 mg chlorpheniramine given intravenously. One of subjects with TD of H of 0.16 mg, was tested first with chlorpheniramine, 10 mg, and his TD of H increased to 0.64 mg—one of the closed circles at this dose level—and then with 15 mg chlorpheniramine.
Figure 3. Influence of chlorpheniramine injected intravenously on threshold dose of inhaled allergen. Threshold dose of allergen is expressed in protein nitrogen units delivered to patient. As in the case of histamine threshold doses, dose delivered was ten times less concentration of agent used for nebulization (see Methods). For abbreviations and symbols, see Fig 2. One of the two subjects who did not increase his TD of A after 10 mg chlorpheniramine was retested with 15 mg chlorpheniramine (open circle).
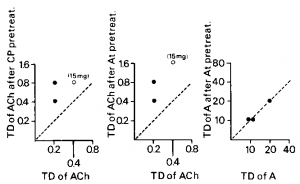
Figure 4. Effect on threshold dose of allergen of dose of atropine having an anticholinergic activity similar to anticholinergic activity of 10 or 15 mg chlorpheniramine given intravenously. Left panel: influence of intravenously given chlorpheniramine on threshold dose of acetylcholine. Middle panel: influence of 0.4 mg atropine given subcutaneously on threshold dose of acetylcholine. Right panel: influence of 0.4 mg atropine given subcutaneously on threshold dose of allergen. Abbreviations: ACh indicates acetylcholine; AT, atropine; and remaining abbreviations are noted in legend for Figure 2.
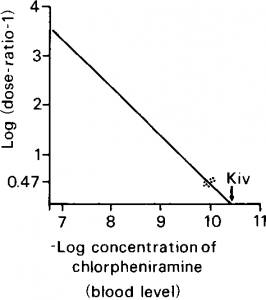
Figure 5. Plot of—log concentration of antagonist versus log (dose-ratio-1). Kiv represents association constant of antagonist as determined from assumed blood levels of chlorpheniramin


